Members Spotlight: British Fashion Council
// Member News // Members Spotlight
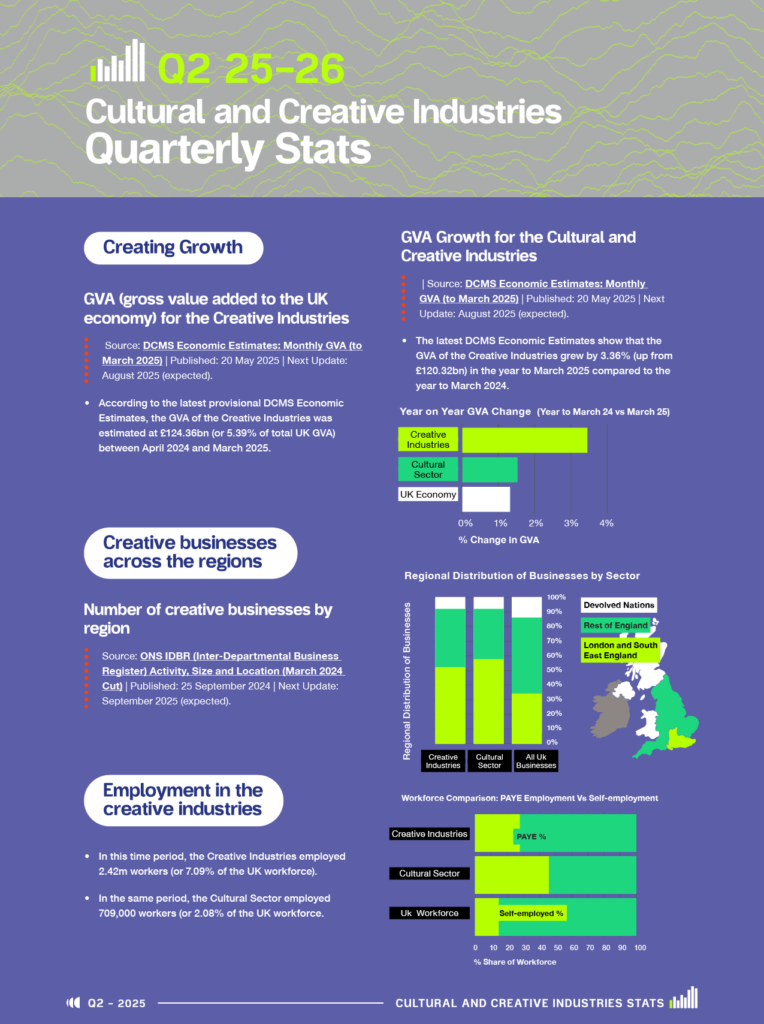
Every quarter we bring our members the latest data from the UK’s cultural and creative industries. The Quarterly Statistical Bulletin brings together figures on employment, GVA, cultural and creative businesses, import and export value, workforce demographics and earnings, and creative education and skills.
The full report is designed exclusively for our members who can download it from our members portal. In the infographic seen below, you can see some of the key data included in our latest statistical bulletin for Q2 of 2025-26. You can also view the PDF of the infographic here.
To learn about membership of Creative UK, visit our membership page.